Overview - Z-Tools Map
STREET MAP NOT SHOWING UP: we are experiencing some issues with our street map. Here is a work around - need to do this for each project you work with.
- PROJECT TAB - set the Custom Map setting to either Kentucky Base Map or Street Map - click Save Settings
- MAP (OPEN PROJECT) TAB - the map opens. Use the Base Map option and check Custom Map to turn on the Custom Map.
- Using GIS Manager - click the Custom Map list item on the left lower panel list to turn on the Custom Map
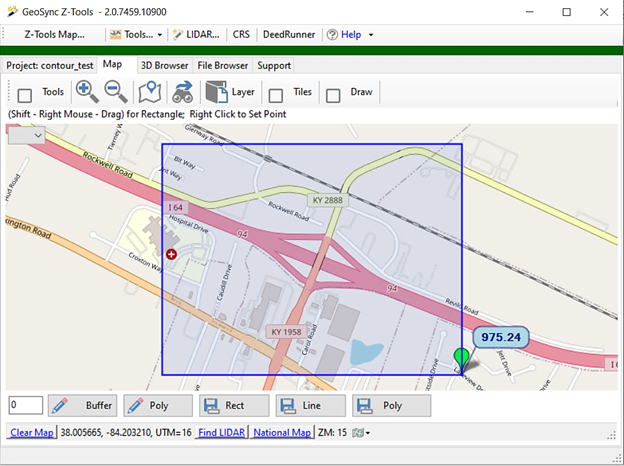
The primary purpose of the street map is to delineate target areas for finding, downloading, and clipping elevation data. The map provides tools to draw a polyline, buffered polyline, polygon and rectangle. Existing XML files in the XML Folder can be imported into the map for visualization purposes. The map supports display of XYZ Tile layers stored in the xyz_tiles folder. The map provides direct links to the USGS National Map for reference purposes. A Find Lidar link is included to search indexed tiles and draw them on the screen. Zooming in beyond level 14 will display a marker on the screen. Clicking the marker at its bottom will open an ID window containing a download link and tile information.
- Tool Strip – refers to the tool strip at the top of the map window
- Status Strip – refers to the strip of labels and links at the bottom of the map window
- Tool Panel – refers to a docked panel at the bottom of the map window opened and closed by toggling the Tools checkbox on the Tool Strip
- To pan the map - hold left mouse button and drag
- To zoom in and out – use the buttons on the Tool Strip or use the scroll wheel
- To set a point – right click the mouse
- To draw a rectangle – hold the shift + right mouse and dragTo draw a polyline – check the auto draw option and right click on the screen to set points a line will be created automatically
- To draw a polyline – check the auto draw option and right click on the screen to set points a line will be created automatically
- To draw a buffered polyline – draw a polyline and enter the buffer distance in feet then click the Draw Line button
- To draw polygon – draw a polyline and then click the Draw Poly button
- Save Rect button – saves the current rectangle as XML in the XML folder
- Save Line button – saves the current polyline as XML in the XML folder
- Save Buffer button – saves the current buffer feature as XML in the XML folder
- Save Poly button (same as Save Buffer button) – saves the current polygon feature as XML to XML folder
- Clear Map link – on the Status Strip clears the map of all displayed features including rectangles, lines, polygons, buffers, and points.
- Remove a point from the feature – open the Tool Panel and uncheck the point the point list and click either Draw Line or Draw Poly to update the feature
- Find Lat Lon button – binocular button on the Tool Strip allows the entry of latitude and longitude. Clicking OK will zoom the map to the location. Tool provides a list of Cities with populations over 10,000. Find the nearest city and click OK to zoom the map.
- National Map link – located on the Status Strip and opens the USGS National Map application in the default browser and zooms to the current map location. If not visible right-click with the mouse in the center of the screen to initialize.
- Find LIDAR link – uses the current map location to query USGS resources to identify available DEM and LiDAR resources.
- Custom Map Button on the task bar – switch between the custom base map configured on the Map settings tab and the street map. This provides access to an aerial view.
- Open XML link – opens a file browser to the XML folder. Pick an XML file to load. This can be used with exports from QGIS and ArcMap.
- Tiles checkbox – if an XYZ tile source has been specified for this project then checking the box will change the background map from a street map to XYZ tile source. Only zoom levels with available cached tiles will be shown.
- DEM checkbox – if a custom DEM has been set for this project the checkbox will toggle it on and off. Right clicking on the screen with the bounds of the DEM will query the elevation at that location.
- Tool Panel Tabs (Toggle Tools checkbox on the Tool Strip):
- Boundary – default view for drawing boundaries for querying data
- Layers / Tiles - Access to the Manage Layers tool and ability to set the active XYZ Tile layer and active DEM
- Open Layer Manager – provides quick access to the Manage Layers tool to switch XYZ Tile Layers
- XYZ Tile list – drop down list of available XYZ Tile Layers from the xyz_tiles folder
- DEM list – drop down list of available DEMs from the xyz_tiles folder. These are created when hillshade tiles are created from DEMs or DSMs. When selected statistics are listed in the list on the left.
- Ref list – drop down list of available XML layers from the xml folder to be displayed as reference
- Zoom to Tile Center – button zooms the map to the active XYZ Tile Layer